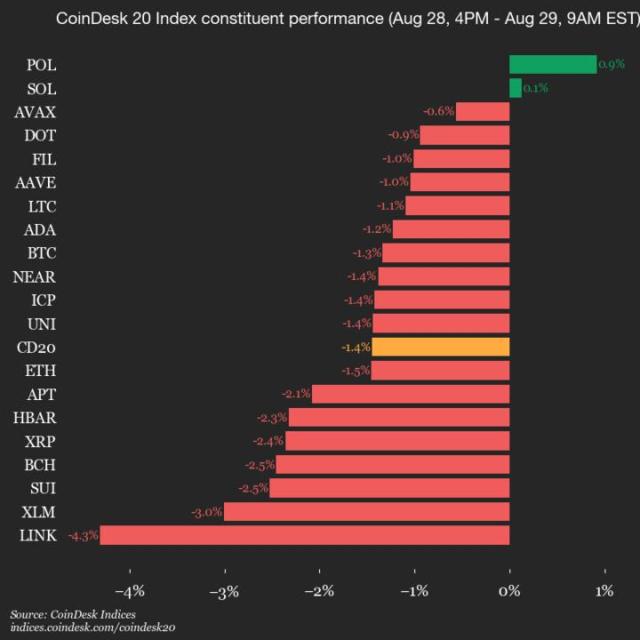
Bitcoin has struggled over the past 30 days, falling more than 6% while Ethereum has gained more than 16% over the same period. Over the past week, BTC has fallen another 2% and is currently trading below $111,000.
This level is important because the invalidation point is around $108,600 — a break there could send Bitcoin into deeper losses. However, on chain signals suggest there may be a chance for a recovery, with a key group of investors flashing the strongest bullish signal in a month.
Profitable supply nears local lows
One of the important on- chain metrics for Bitcoin is the percentage of supply that is in profit.
On August 25, 2025, this ratio dropped to 88.53%, near the three-month low of 87.02% recorded on June 22, 2025. The decrease in profitable supply in June triggered a price rally, with BTC rising 22% in the following weeks.
A similar pattern occurred on August 2, 2025, when the index dropped to 91.64% from a high of 98.91%. After that drop, Bitcoin's price rebounded by nearly 10% in just 10 days.
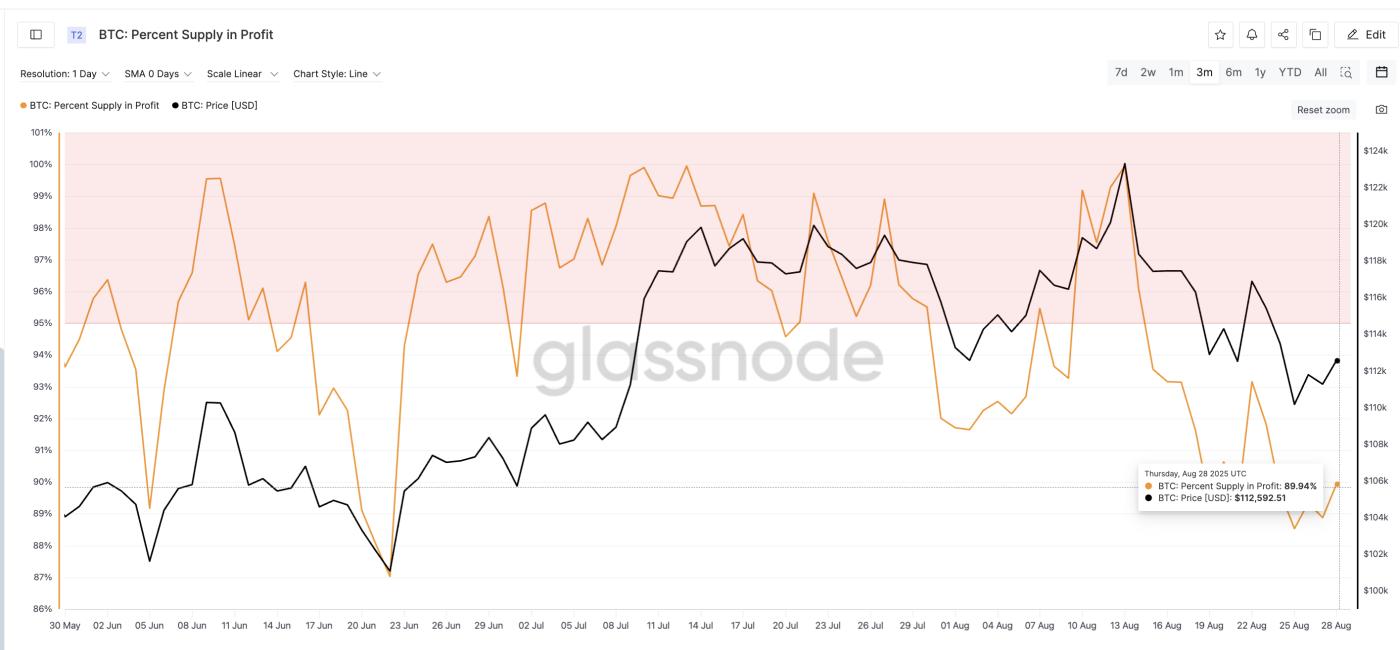 Bitcoin Price and Profitable Supply: Glassnode
These examples show that when fewer holders are profitable, there is less incentive to sell. While this indicator can also sometimes signal weakness or even panic selling, in this case it is near levels that have triggered strong moves up in the past.
This is why the supply-side index is important to track — but it shouldn't be read in isolation.
To stay updated on TA and the Token market: Want more Token insights like this? Sign up for Editor Harsh Notariya's daily Crypto Newsletter here .
Long-term investors become net buyers
This time, the stronger signal comes from long-term investors, often referred to as “HODLers.” Their net position change shows whether they are adding or subtracting from their Bitcoin holdings each month.
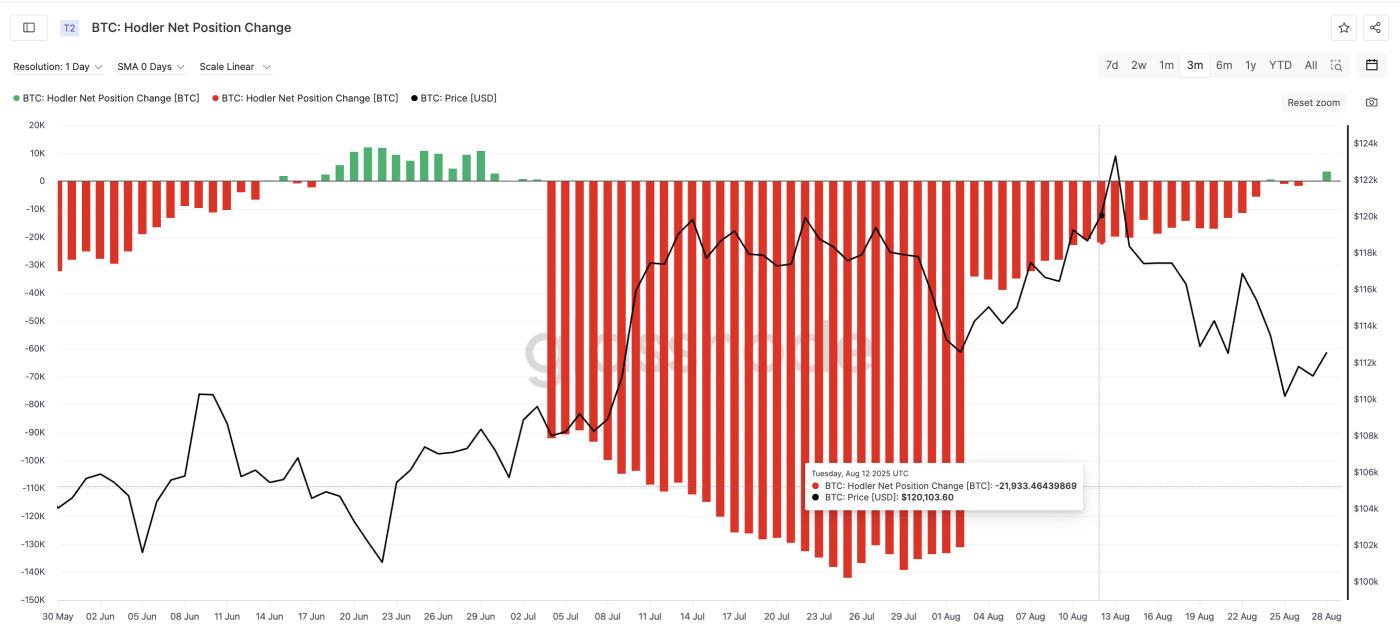 Bitcoin Price and HODLer Position Change: Glassnode
Since late July, this group has been on the sidelines or even selling, keeping the index mostly negative. The only brief green flash was on August 24, 2025, coinciding with a small rally from around $110,000 to $111,000, although it did not last as the selling quickly resumed.
However, the indicator has now turned clearly positive for the first time in a month, showing an increase of 3,429 BTC.
This is the strongest accumulation signal since late July. When this group of long-term investors last moved aggressively into accumulation — around June 22, 2025 — it coincided with the same period when profitable supply Dip, and Bitcoin rose from $101,084 to $123,313, a 22% gain.
That history makes this change significant. If these investors continue to add rather than quickly withdraw, it could provide the basis for another rally.
Bitcoin Price Levels and Recovery Zones to Watch
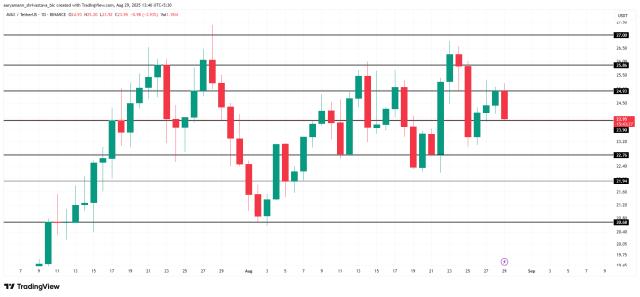
At the time of writing, Bitcoin price is trading below $111,000. It has broken a key support around $111,074, and the next immediate support lies at $110.50, with a deeper safety net at $108,600.
If this final level is broken, the bearish scenario will strengthen and invalidate any calls for a BTC price recovery . This could happen if the bullish signal led by HODLers fades.
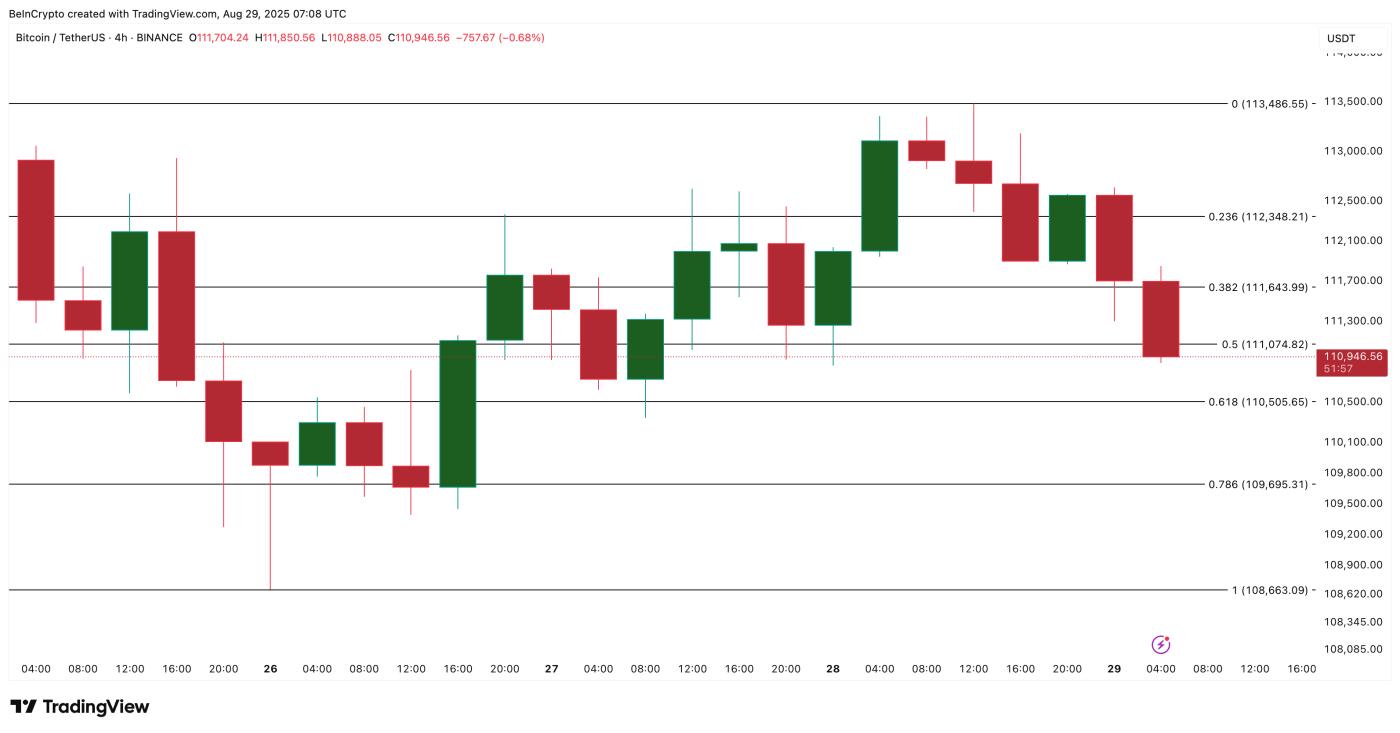 Bitcoin Price Analysis: TradingView
On the upside, however, the picture is different. The first recovery zone appears around $113,400. Reclaiming and holding above that level would be more than just a short-term bounce — it would give Bitcoin price the signal strength to aim higher once again.


