Bitcoin (BTC) price remains under pressure, consolidating above the $111,980 support after falling more than 3%.
BTC ’s correction continues as weak demand and profit-taking continue to exert pressure, with exchange-traded funds (ETFs) recording outflows of over $1.15 billion.
Bitcoin Spot ETFs Record Highest Weekly Outflows in Five Months
Bitcoin prices continued to correct over the weekend, falling nearly 8% from its All-Time-High of $124,747 on August 14. A drop in institutional demand has fueled the price correction .
Data from SoSoValue shows that Bitcoin Spot ETFs have recorded a total of $1.15 billion in outflows through Thursday, the highest level since early March. If these outflows continue and increase, BTC could continue to correct in the coming period.
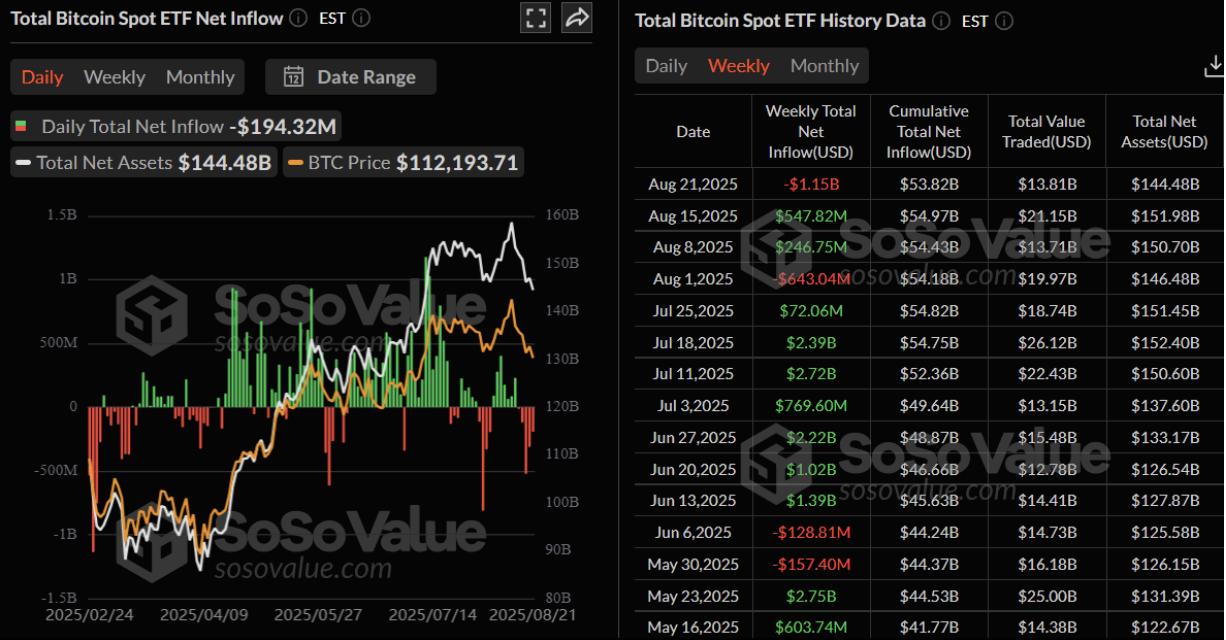 Bitcoin Spot ETF weekly net money flow chart. Source: SoSoValue
on-chain data shows profit-taking fueling BTC correction
CryptoQuant’s weekly report on Wednesday highlighted that reduced demand and profit-taking were the main factors leading to BTC’s correction.
The chart below shows that BTC demand continues to weaken. Bitcoin's apparent demand has dropped from its July peak of 174,000 BTC to 59,000 BTC on Wednesday.
At the same time, demand from large institutional investors has also slowed, with 30-day ETF net buying (red) standing at 11,000 BTC, the lowest since April 25, and Strategy accumulation (gray) plummeting from 171,000 BTC at the November 2024 peak to 27,000 over the past 30 days, indicating a weakening momentum, which may have contributed to the recent price correction. If demand continues to decline, Bitcoin will likely remain in a consolidation phase or continue to correct.
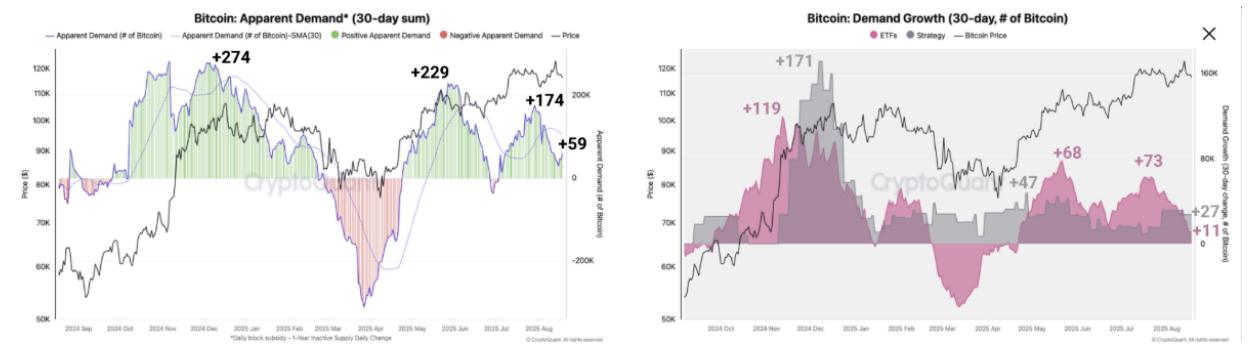 Bitcoin 30-day apparent total demand chart (Left). Bitcoin 30-day demand growth chart (Right). Source: CryptoQuant
Glassnode ’s report also supports this bearish thesis. The chart below shows that Open Interest (OI) on Bitcoin Futures Contract remains high at $67 billion, indicating that leverage conditions are overheated and that even moderate price movements can trigger a significant contraction in leveraged positions.
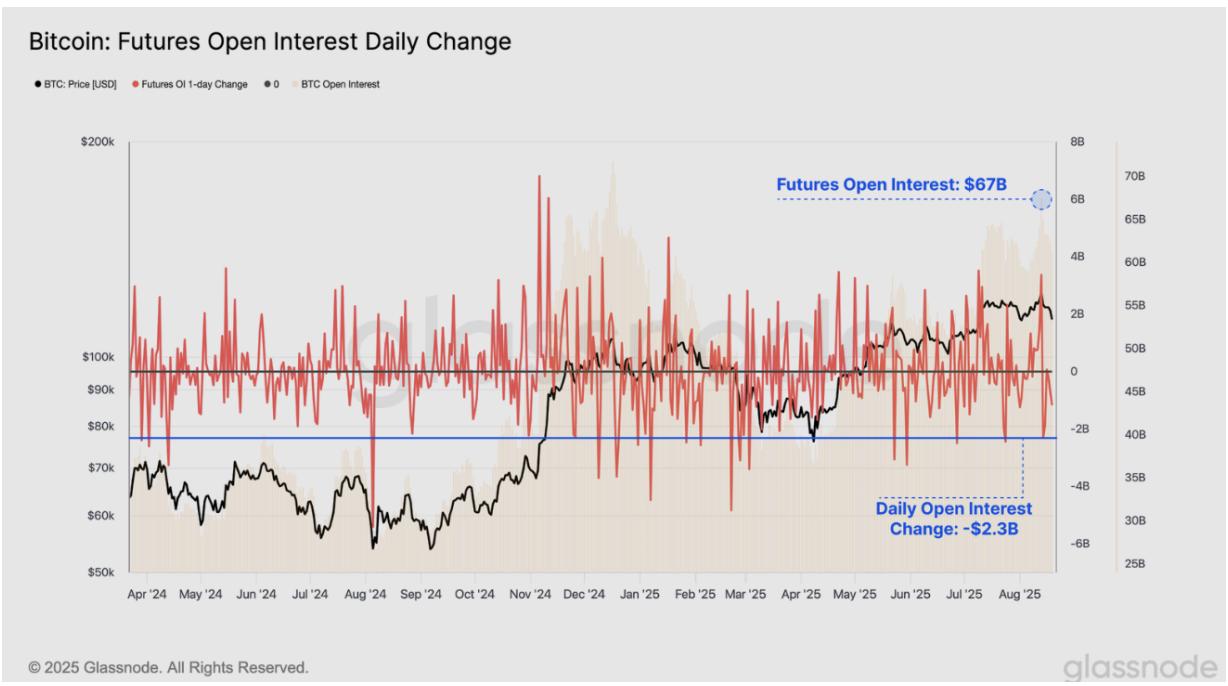 Daily Change in Bitcoin Futures Contract Open Interest. Source: Glassnode
The report further explains that while liquidation volumes were triggered during this correction, with shorts reaching $72.8 million above the record high, and longs reaching $99 million during the downtrend, they were still low compared to what was seen during similar price movements in July.
This suggests that a significant portion of the recent contract closures were likely voluntary and therefore risk-managed, rather than forced liquidations as excessive leverage was removed.
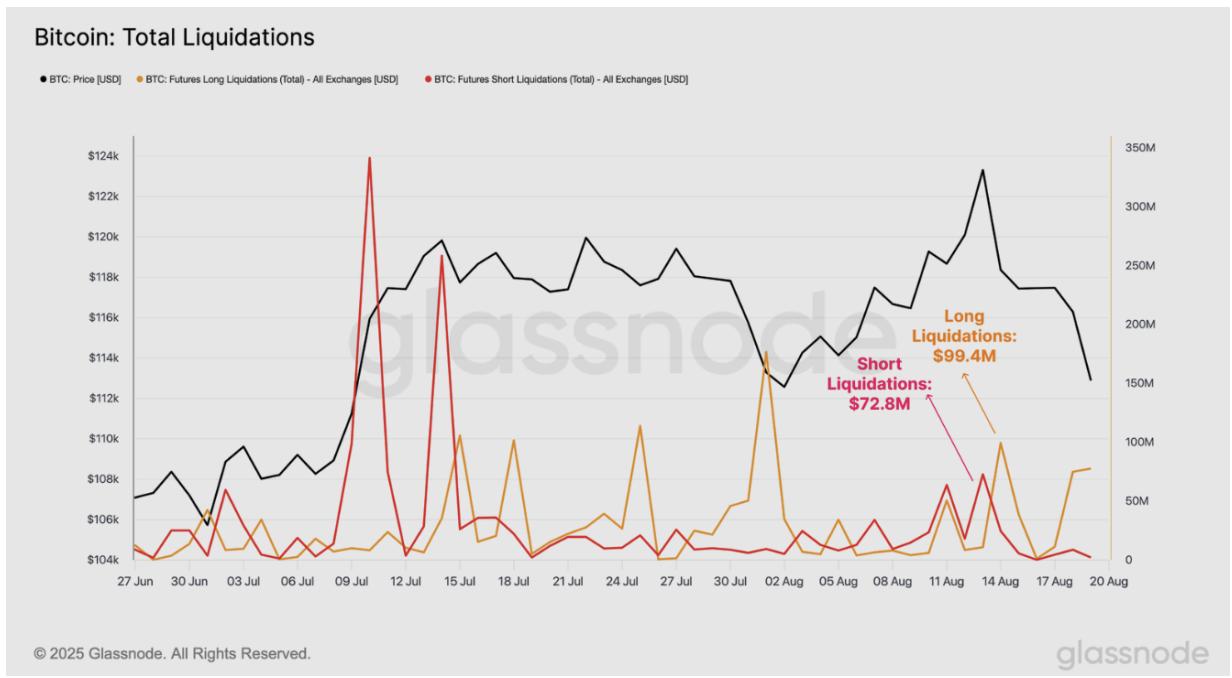 Total Bitcoin Liquidation. Source: Glassnode
Bitcoin Drops After FOMC’s Tough Stance
On the macroeconomic front, minutes from the Federal Open Market Committee (FOMC) meeting in late July, released on Wednesday, struck a hawkish tone. Policymakers expressed greater concerns about Dai inflation than the labor market, putting downward pressure on risk assets like Bitcoin.
This tough stance comes after US Producer Price Index (PPI) data far exceeded economists’ expectations, suggesting that inflation is gradually climbing, leading to BTC falling 1.58% last week.
Traders remain cautious as Bitcoin is showing weak momentum.
Some optimistic signs
Although BTC continued to correct this week, firms like Metaplanet and Strategy added a total of 1,185 BTC on Monday, comfortably buying on dips.
During the same period, CMB International Securities, a subsidiary of China Merchants Bank, announced the official launch of virtual asset trading in Hong Kong, supporting BTC, ETH , and USDT trading. This announcement marks a milestone as it becomes the first brokerage firm affiliated with a Chinese bank to conduct this business in a compliant manner, including major coins such as Bitcoin and Ethereum.
Additionally, news that US President Donald Trump is preparing for a trilateral meeting with Russia and Ukraine has emerged. This has raised hopes of a breakthrough to end the protracted war between Russia and Ukraine and could help improve risk sentiment, which could boost investor confidence and fuel the growth of cryptocurrencies like Bitcoin.
Is BTC out of trouble yet?
BTC has fallen more than 8% from its record high of $124,747 on August 14, 2025, closing below an ascending trendline drawn by connecting multiple Dip from early April this week, and retested support at $111,980 on Thursday. At the time of writing on Friday, it was hovering around $113,200.
If the support at $111,980 holds and BTC recovers and closes above the 50-day Exponential Moving Average (EMA) at $114,788, it could extend the recovery towards the next daily resistance at $116,000.
However, the Relative Strength Index (RSI) is at 42, below the neutral value of 50, indicating bearish momentum. For the recovery momentum to be sustained, the RSI needs to break above its neutral level.
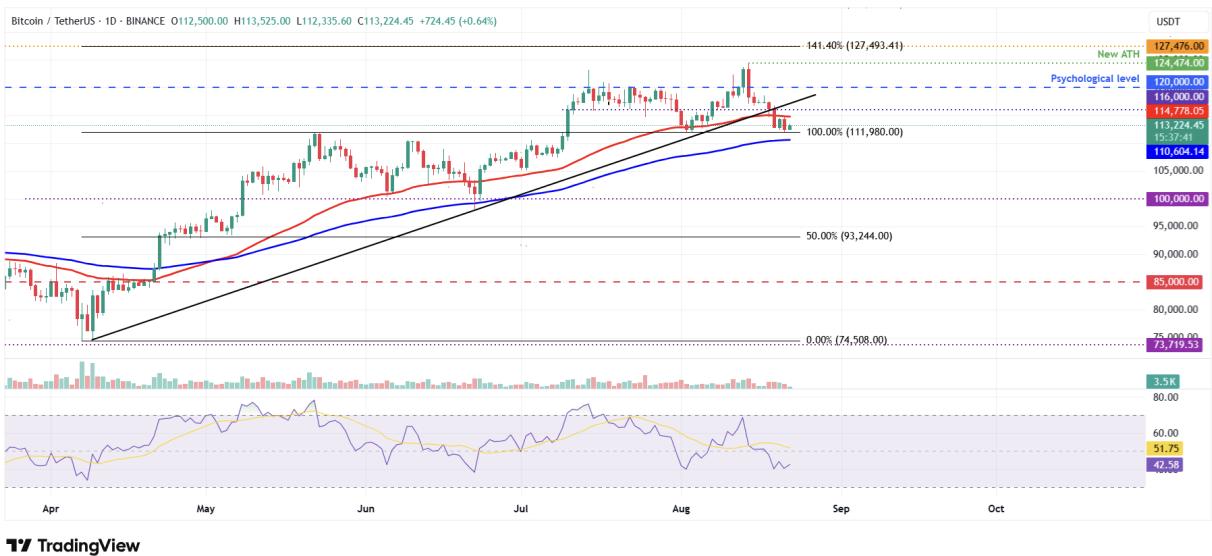 BTC/ USDT daily chart. Source: TradingView
However, if BTC continues to correct and close below the $111,980 support, it could extend the decline towards the 100-day EMA at $110,604.