I. Weekly Market Review: (08.11~08.17)
The opening price this week was 119,294.27 points, reaching the highest price of 124,474.00 points on Wednesday, the lowest price of 116,803.99 points on Thursday, and closing at 117,405.01 points. The weekly decline was 1.61%, with a maximum amplitude of 6.42%, and a trading volume of $14.413 billion. A long upper shadow green candle, commonly known as an "inverted hammer", was formed this week, with significantly increased trading volume and the price closing below the 5-week moving average.
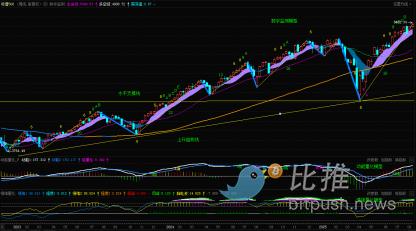
Bitcoin Weekly K-line Chart: (Momentum Quantitative Model + Sentiment Quantitative Model)
Figure One

Bitcoin Hourly K-line Chart:


Figure Two
In the previous weekly review, the author predicted that BTC prices would continue to rise and maintain a range-bound structure this week. The first resistance level was around 120,800 points, with a strong resistance at 123,218 points. The first support level for downward adjustment was around 118,800 points, with a strong support at 114,200 points.
The previous strategy was to maintain a 30% medium-term position, hold cash, and wait for a clear medium-term direction before taking action. For short-term positions, set stop-loss points based on predicted support and resistance levels, going long on dips and short on highs.
Actual trend review this week:
On Monday, Bitcoin opened at 119,294 points and gradually rose to 122,335 points before quickly falling, closing with a 0.51% decline "inverted hammer" candle with an amplitude of 3.59% and increased trading volume;
Tuesday closed with a 1.21% green candle;
On Wednesday, prices continued to surge, with market long sentiment high, breaking through the July 14th high of 123,218 points, closing with a 2.57% green candle. However, the trading volume was significantly lower than on July 14th, considered a "false rise" that requires volume confirmation in the following days;
On Thursday, prices continued to rise, creating a new weekly and historical high of 124,474 points before quickly falling, closing with a 4.24% large red candle, an amplitude of 5.91%, with a volume increase during the decline. The red candle body "engulfed" the previous two days' gains, indicating that recent buyers were trapped;
Friday continued the downward momentum with a 0.81% small red candle; the next two days were characterized by narrow oscillations, forming two doji candles.
This week's price movement was like a "roller coaster" with a maximum amplitude of 7,670.01 points. After 31 trading days of consolidation, the previous high of 123,218 points was broken on Wednesday. The author considers this week's action as a "bull trap" with more intensity than expected, largely in line with the previous prediction and confirming the high-level risk previously emphasized.
The author will now analyze the internal structure changes from a multi-cycle technical perspective.
1. As shown in Figure One, from the weekly chart:
①Momentum Quantitative Model: Continues to signal high-level blunting, a precursor to potential top divergence. Momentum Line 1 remains flat, with energy (red) column shorter than last week.
②Sentiment Quantitative Model: Two sentiment indicators gradually decreasing, with peak value at 0.67.
③Digital Monitoring Model: No digital signals currently displayed.
These data suggest the weekly level is in an adjustment phase, with attention on potential top divergence formation.
2. As shown in Figure Two, from the hourly chart:
①Momentum Quantitative Model: This week's two momentum lines moved from death cross to golden cross and back to death cross, with energy columns changing from green to red to green, indicating a "roller coaster" price movement with large volatility.
②Sentiment Quantitative Model: Friday's two sentiment indicators fell from high levels.
③Volume: Daily trading volume did not significantly increase during price rises but expanded during declines.
II. Next Week's Forecast: (08.18 ~08.24)
1. Bitcoin is expected to trend with oscillating downward movement, with potential technical rebounds at support levels.
2. Resistance levels: First resistance at 120,250 points, strong resistance between 122,000 and 123,218 points.
3. Support levels: First support at 114,200 points, strong support between 111,980 and 110,530 points. The probability of retesting this area is extremely high, with key focus on this range.
III. Next Week's Trading Strategy (excluding unexpected events): (08.18 ~08.24)
1. Medium-term position: Maintain around 30%, hold cash, wait for a clear medium-term direction.
2. Short-term position: Set stop-loss points, primarily short (using 1-hour periods)
①Short at 117,400 points, stop-loss at 118,600 points;
②At 114,200 points, sell half of previous short positions, move stop-loss to 117,000 points;
③Close remaining short positions when bottom signals appear around 111,920 points.
3. For daily updates, follow the "Bitpush TG Exchange Group" below to read the author's daily market commentary.
These models are personal trading rules and do not constitute any trading advice. Personal opinion, for reference only.
Author: Cody Feng
Twitter:https://twitter.com/BitpushNewsCN
Bitpush TG Exchange Group:https://t.me/BitPushCommunity
Bitpush TG Subscription: https://t.me/bitpush