Solana's price may be cooling down from its recent high of $168, but the larger structure still supports the buy side.
Despite the correction to $160, three important indicators suggest this is just a temporary pause, not a collapse.
Funding rates remain positive, reflecting optimistic sentiment
Solana's funding rate bars remain green, indicating long-term buy positions are dominating the market. Even with a slight price drop, traders continue to pay fees to maintain long-term buy positions, meaning most expect the price to rise again.
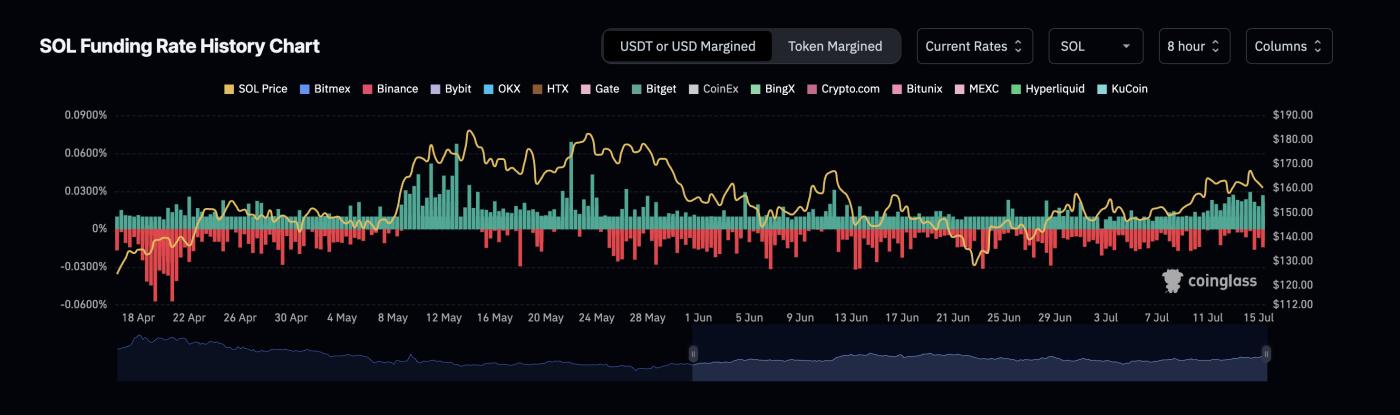 SOL Price and Funding Rates: Coinglass
There are no signs that the sell side is in control. This typically signals that buyers are ready to hold positions through fluctuations.
Funding rates are periodic payments between buy and sell traders in perpetual futures contracts. When the rate is positive, the buy side dominates and pays the sell side, indicating a price increase trend.
20/50 EMA Golden Cross confirms upward trend
Solana recently saw the 20 EMA (exponential moving average) crossing above the 50 EMA on the daily chart. This Golden Cross is a bullish signal showing short-term momentum is returning. However, this crossover did not occur on a strong green candle; it appeared on a red candle with long wicks, indicating market hesitation.
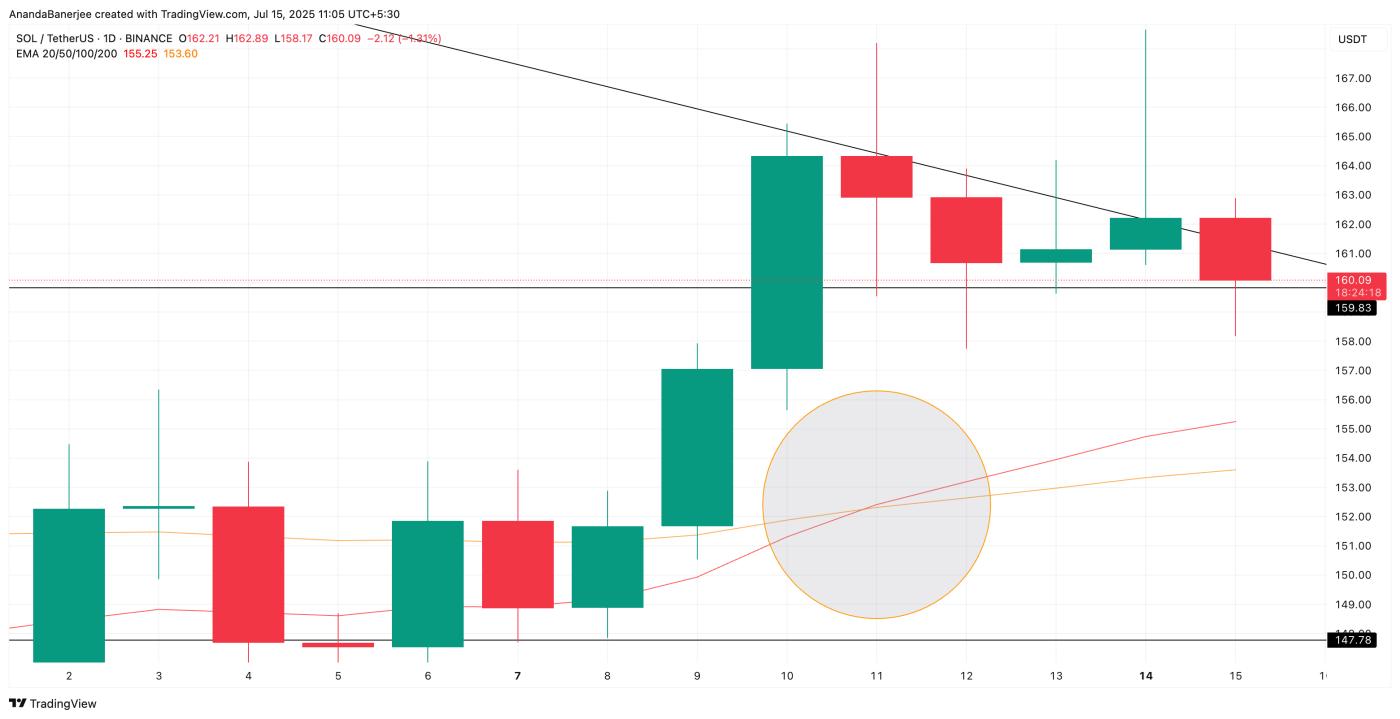 Solana Price and Golden Cross: TradingView
Nevertheless, this crossover supports the idea that SOL's price trend is shifting upward, even if the immediate momentum seems unstable.
Solana price remains above important support; structure remains intact
Despite the correction to $160, Solana remains above the critical support zone near $158, as predicted by the Fibonacci retracement indicator, a useful tool for drawing important support levels in an upward trend.
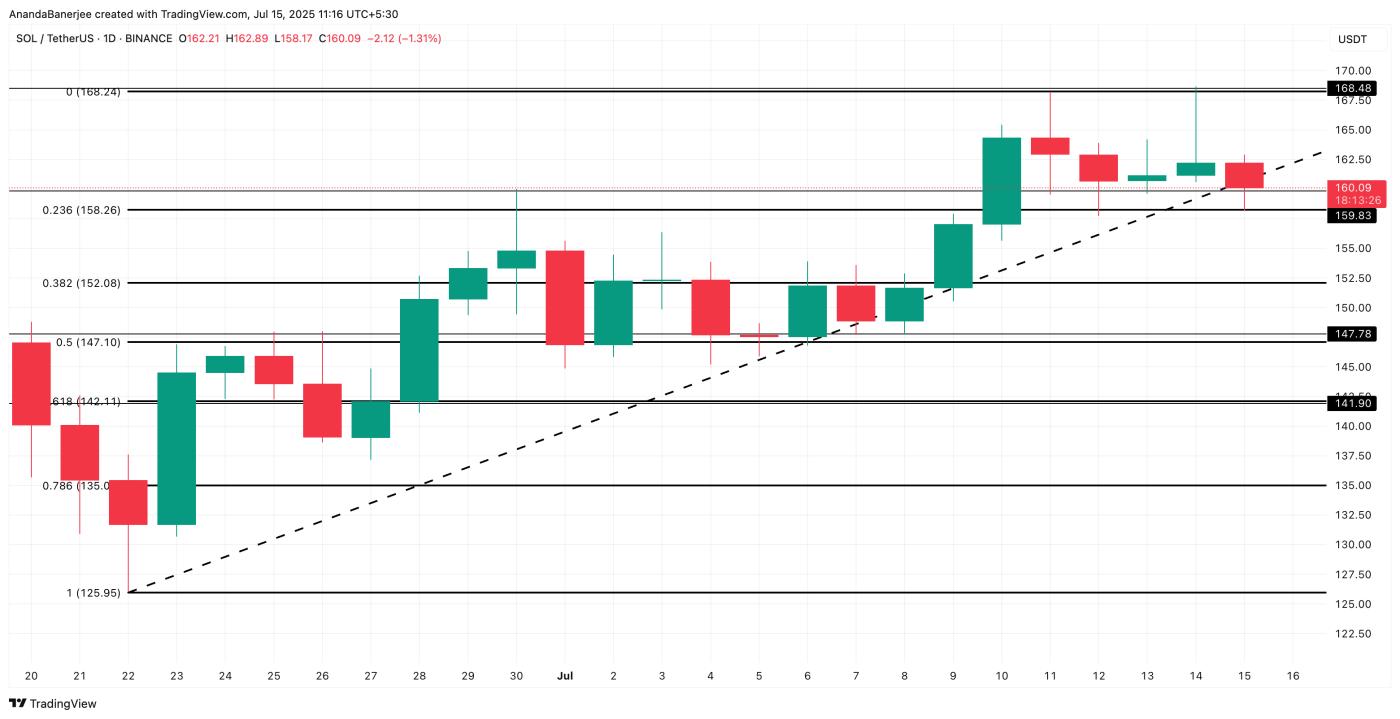 Solana Price Analysis: TradingView
On the upside, if Solana reclaims $168, with funding rates continuing to remain positive, the next price increase will open up. This would allow SOL price to reach levels of $179 and even $184, provided the broader market sentiment remains optimistic.
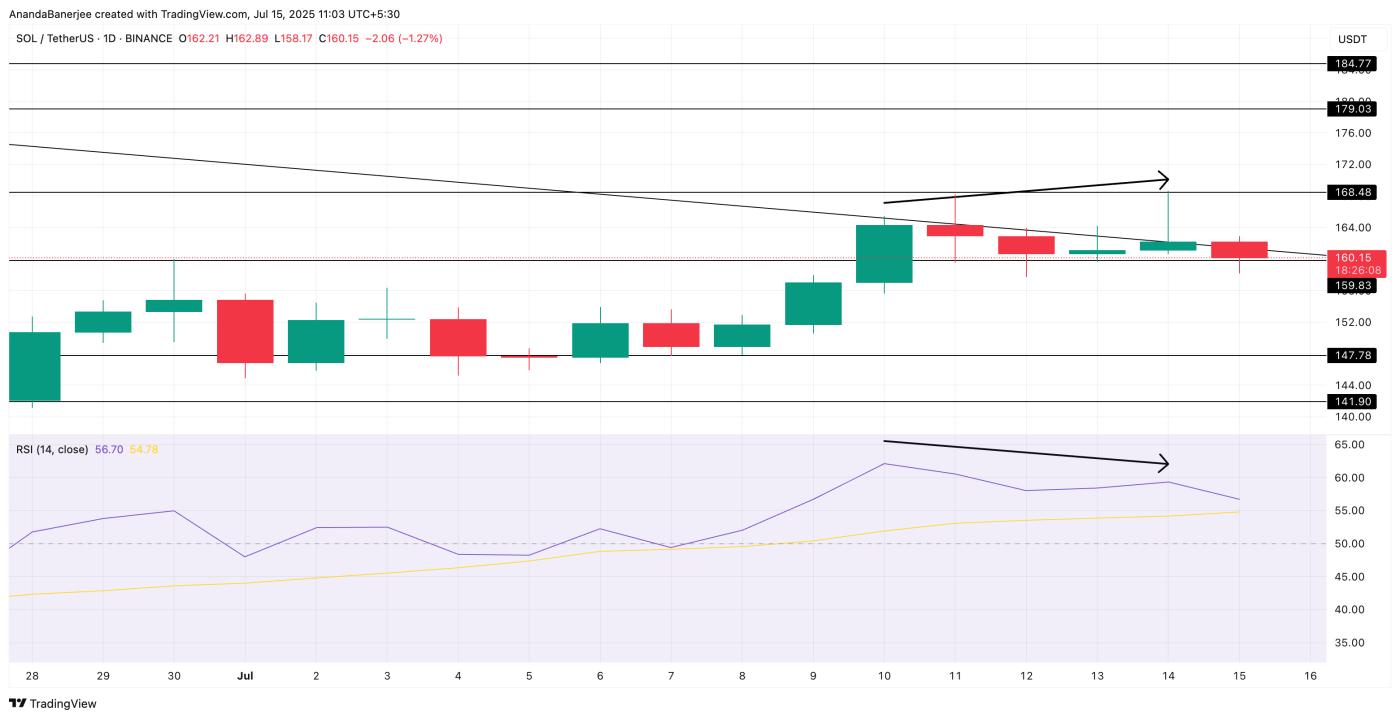 SOL Price Action and RSI Divergence: TradingView
However, there is a clear bearish RSI divergence between July 10 and July 14. SOL price created a higher high, but RSI created a lower high; a sign that momentum is weakening even as SOL price pushes up. This divergence typically leads to short-term corrections, which we are currently seeing.
Additionally, RSI is beginning to curve down after approaching its signal line, further reinforcing the case for a temporary cooldown.
RSI (Relative Strength Index) is a momentum indicator tracking how strong buying or selling pressure is. Divergence, when price increases but RSI decreases, often means momentum is fading.
The bearish RSI divergence, if accompanied by a drop below $158, could invalidate the broader bullish structure. And a correction to $152 (0.382 Fib level) or lower ($147) could reverse the structure to bearish in the short to medium-term timeframe.