

The market has been quite interesting recently: After a brief dip, Bitcoin returned to the familiar level of $106,000, resembling a "stuck in a dilemma" phase. The fear and greed index is neutral, with investors adopting a cautious wait-and-see attitude. However, technically, something big might be brewing quietly.
Pullback Ending? A Wave Chart Suggests: $130,000 Is Not a Dream
A analyst named XForceGlobal recently shared an Elliott Wave structure chart on X, pointing out that Bitcoin's current pullback is near its end. He analyzed the decline since May using a WXY three-segment structure, believing this downward movement closely matches the correction pattern of the second wave, with Fibonacci retracement falling precisely between 23.6% and 38.2%.
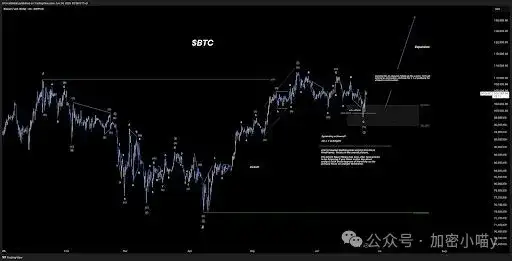
The analyst believes that if the subsequent trend builds a "1-2 launch structure" and breaks through the current interval's high point without creating a new low, Bitcoin's next target will be $130,000. His logic is that if expanded proportionally based on the first wave's increase, the third wave's endpoint is likely to appear around $130,000. This prediction is not arbitrary but based on a complete technical chart structure. The chart also marks a key pivot area, the $98,000 to $102,000 interval, considered the endpoint of the C wave. If the market can initiate an upward move and stabilize in this range, it may signal the beginning of a new major upward trend.
Has Geopolitical Negative News Become a Wash Trading Tool?
On the macro front, a geopolitical news event this week caused market volatility. The U.S. raid on Iranian nuclear facilities caused Bitcoin to briefly drop below $98,200. However, in the following days, with signals of a ceasefire in the Middle East, Bitcoin quickly rebounded, with a cumulative increase of about 8%.
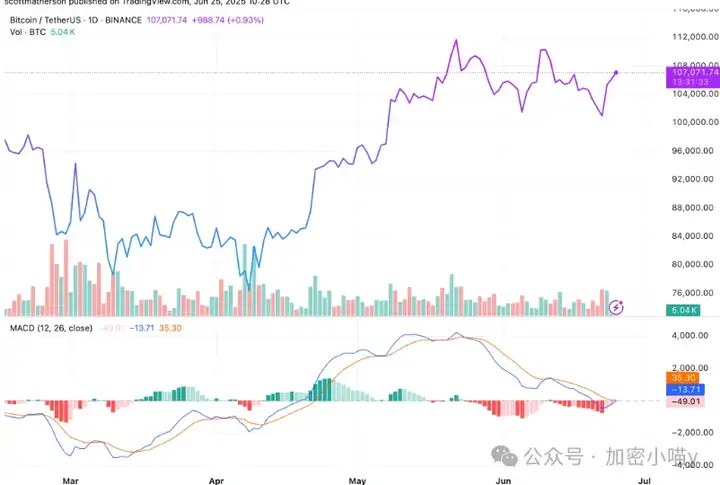
After this negative news wash trading, have the main forces completed their shakeout? From a technical structure perspective, this is quite possible. If there are no new negative news impacts and the price steadily breaks through the upper interval, Bitcoin may have been establishing the bottom of a new market trend.
The current situation is: Structurally, it has the foundation for a significant rise, but still needs price confirmation. If a clear "breakthrough + pullback without breaking previous low" occurs, the third wave will be officially launched, and $130,000 will no longer be a dream but a stage target. The market lacks certainty, not news. Only those who truly understand waiting for right-side signals are qualified to receive the most substantial trend profits.
Market Analysis for 6.26:
Waking up and looking at Bitcoin, it seems everything has changed yet remained the same!
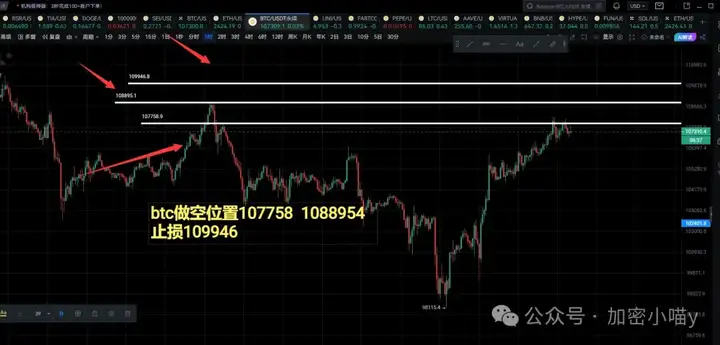
It's still in a oscillation range, with 10,775-10,889 being a clear resistance zone, defensive position set at 10,995, with a low probability of breakthrough in the short term; the 4-hour candlestick pattern without volume selling looks like a bull or bear trap.
On the other hand, the U.S. dollar index has dropped to a new low since April 2025, showing a bottom divergence and potentially ready to rebound, which could pose a potential negative impact on the market.

Altcoins are still weak, pay attention to: #Doge, #ADA, #XRP, #SOL....
Looking at BNB Chain Opportunities:
1、#janitor is absolutely strong, others sell when entering Alpha, but it washes and collects when entering Alpha, targeting Binance and joy, aiming for over 30M market cap.
2、#bmp is the sole survivor in the Non-Fungible Token field, seemingly a token-image exchange, but potentially igniting the NFT 2.0 era, we call it the "chain Bubble Mart".
3、#U well, those who understand KOMA understand, X can't predict the future, the real success depends on offline, I choose to dig deeper for half a year, waiting for a surprise.
That's it for the article! If you're lost in the crypto world, consider joining me in layout and harvesting from market makers! You can join the community via WeChat+QQ group for market analysis, coin recommendations, and positive news... WeChat: Fupi22497 or QQ: 3806326575


